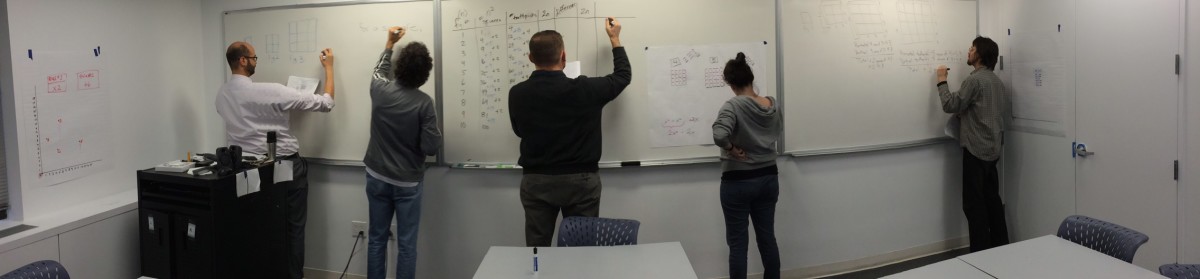

At our evening CAMI meeting earlier this month, Kevin Winkler from CUNY Start led us in an exploration of the conversion between Celsius and Fahrenheit based on something strange he noticed while crossing the Brooklyn Bridge.
I wanted to bring that idea to the afternoon CAMI meeting, and also try to scaffold the exploration a bit, so that we could extend the invitation to our students. It also just happened to be the week where the Midwest was experiencing such cold weather that friends in Minnesota kept making the same joke over and over again about the temperatures there being colder than they were in Antarctica.

The first half of the meeting was a draft of a lesson to encourage learners to think about where the formulas for converting between Celsius and Fahrenheit come from. Even for those of us who have learned the formula at one point, it can be heard to keep them straight. There’s a 9/5 isn’t there? But maybe it’s 5/9? And a 32, but do you add or subtract? And of course, the answers are yes, yes, and yes.
I started the meeting by putting up a weather map from the day before. I didn’t ask any questions, but folks just naturally started talking because it is a compelling topic these days. I heard people saying things like: So much of the country is cold, It’s still in the 60s in Florida, Is Chicago at the 4°? What are those states? Where are the Dakotas? Is Fargo the -23° or the -15°?

Then we shared the hottest and coldest temperatures we’ve each ever experienced:

I then shared the coldest and hottest I’ve ever been:

Or to put in terms of Fahrenheit, -20°F and 110°F.
One thing we noticed is that the coldest temperatures are much closer together than the hottest temperatures. -29° is really cold, but doesn’t seem impossible (especially given the last week) but 43° is very unreasonable as anyone’s hottest temperature, if you are accustomed to Fahrenheit. (Solange, with her European centigrade sensibilities, stepped on my punchline a bit, but so would countless adult education students, many of whom were born in countries that use Celsius).
Next I challenged the group to say as much as they can about Celsius and Fahrenheit, without using any numbers.
- In the US, we use mostly Fahrenheit
- Celsius is metric
- For every temperature at Fahrenheit there is an equivalent temperature in Celsius
- Fahrenheit is warmer (the equivalent temperature is always bigger)
- The world mostly uses Celsius
- Different scales from freezing to boiling point of water (but they both have those as reference markers)
I shared this image and allowed some numbers (but no conversion formulas) to be added to our list;
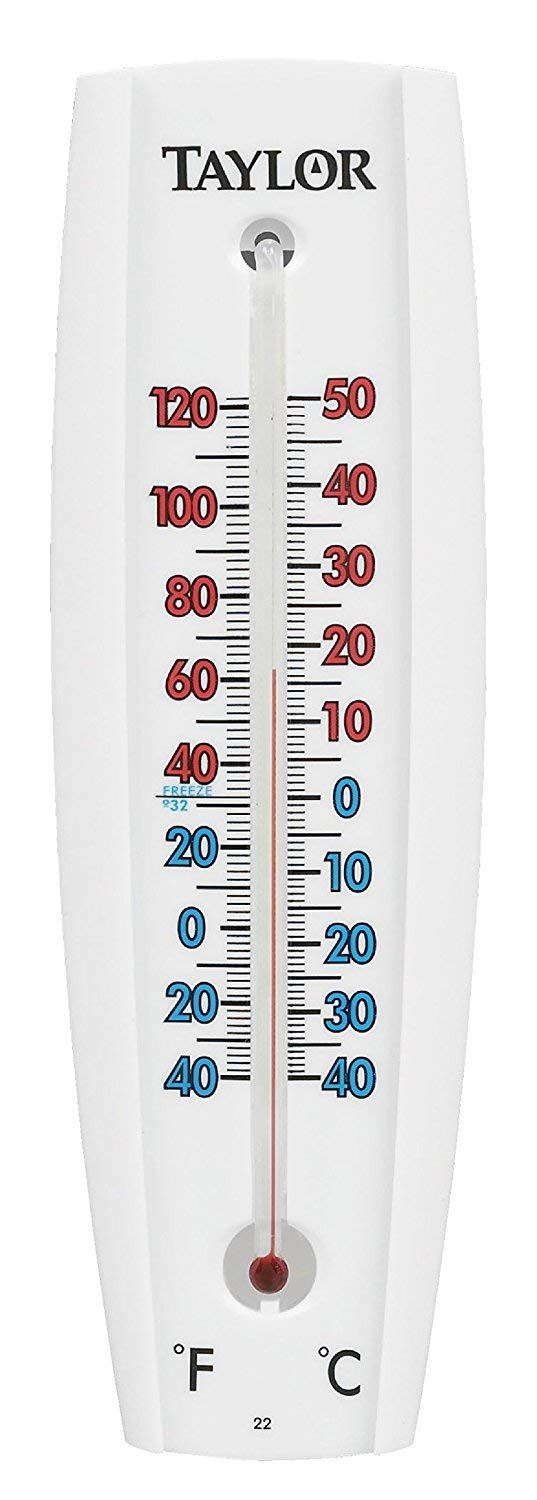
- We mostly live in a 0° C to 40°C world
- On this thermometer, the C is in increments of 10 degrees and the F is in increments of 20 degrees
- This thermometer goes from -40° to 120° Fahrenheit and -40° to 50° Celsius
- Does the mercury react at a different rate at higher or lower temperatures?
- Water freezes at 0° C and 32° F
- Water boils at 100° C and 212° F
Next we looked at a chart and folks did some noticing, first on their own, then in pairs and then as a whole group.
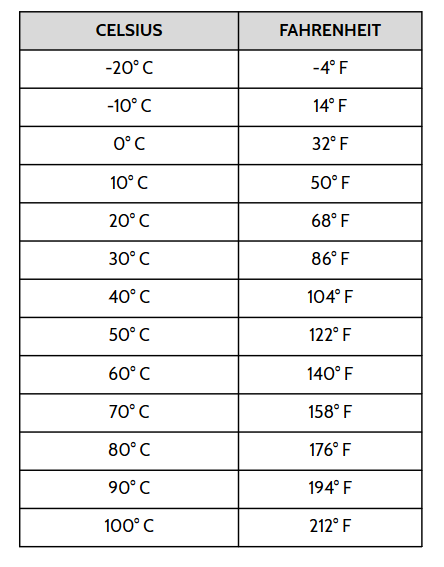
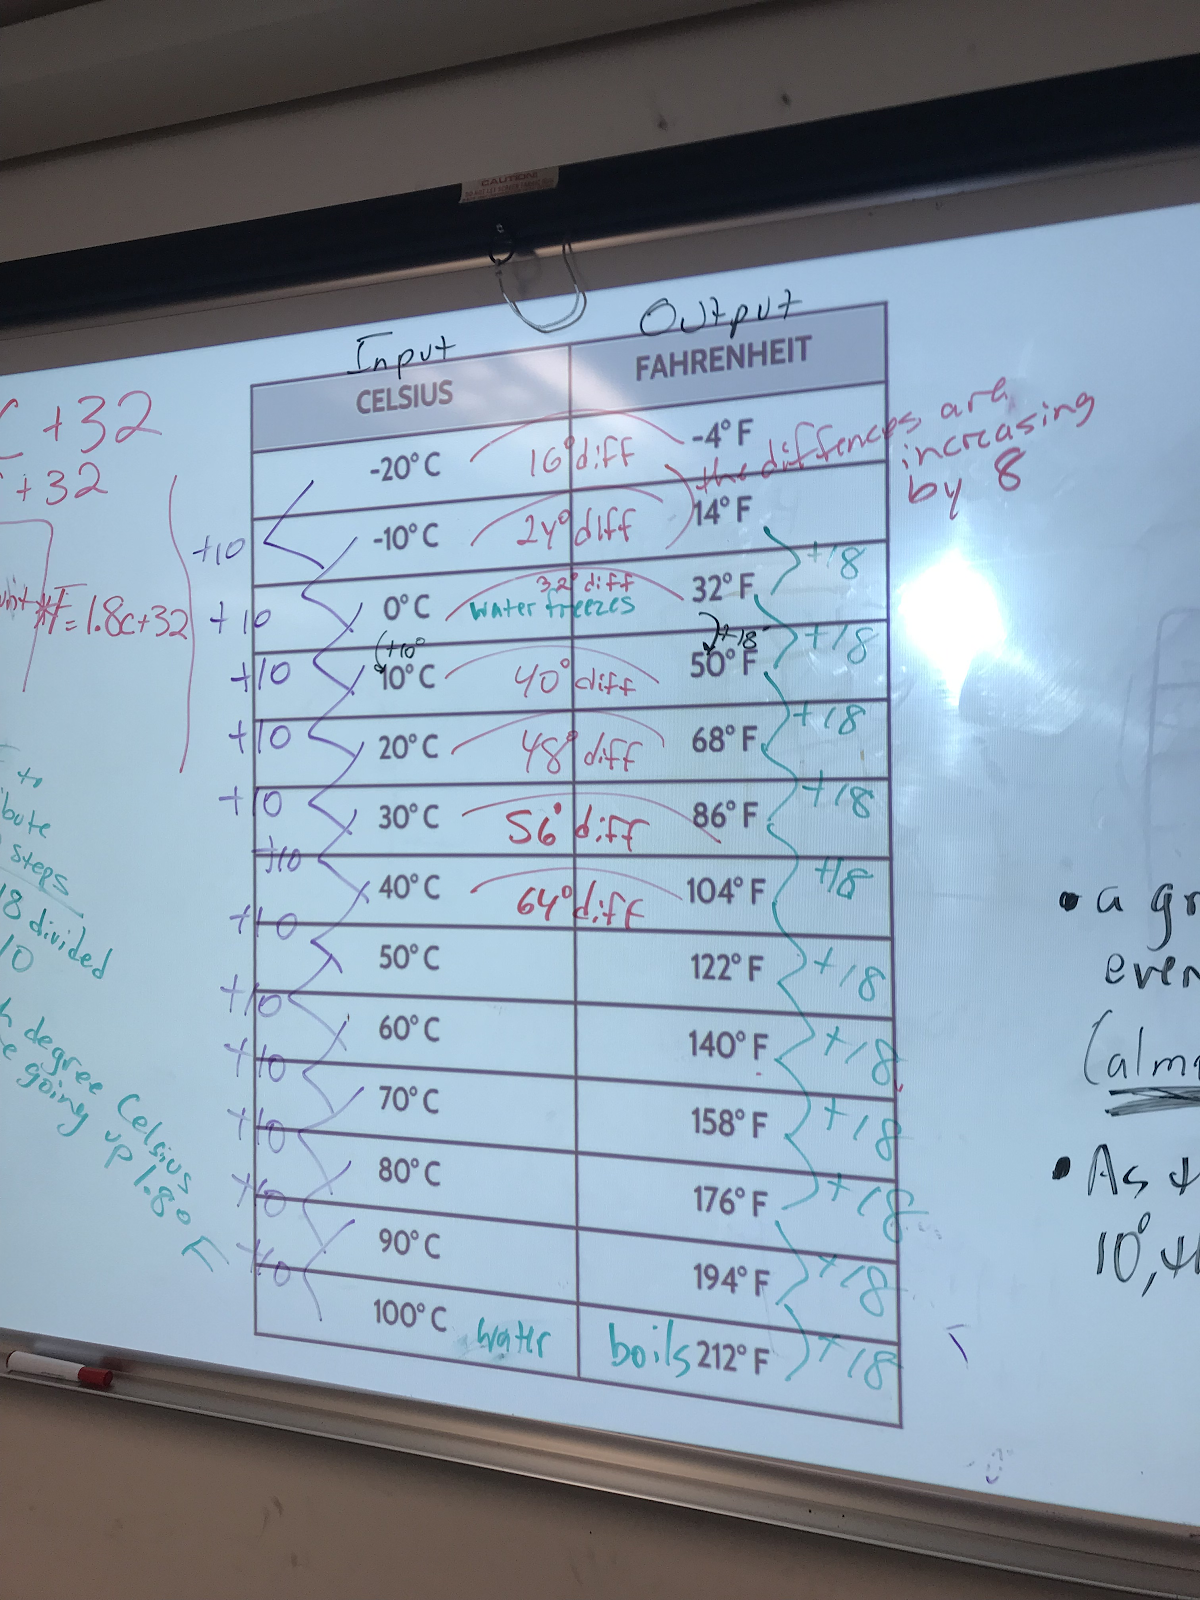
Linda observed that there is a pattern in the difference between the equivalent temperatures and those differences are increasing by 8. Others noticed that the Celsius temperatures were going up by 10 degrees and the Fahrenheit temperatures are increasing by 18 degrees. I asked if a 10 degree change in Celsius the same as a 10 degree change in Fahrenheit?
Eric said he was thinking of the chart as an input/output table. He made the observation that he often thinks of rate of change as the constant change in the output as the input increases by 1, but here we see a growth of 18 degrees F for every 10 degree increase of Celsius. Put another way, as the C increases by 10 degrees, the F increases by 18 degrees. Solange pointed out that the increase in Fahrenheit is almost double the increase in Celsius.
Next I asked folks to work with a partner to fill in this chart, without using any formula they might know. Can it be done?


People used their understanding of y-intercepts (starting amount) and rate of change (slope) to create a function for converting from Celsius to Fahrenheit.
My goal is to help students come away with a strategy for re-creating the function, since it is so easy to mix up the elements, especially with the function for converting Fahrenheit to Celsius having similar numbers.
Once we all agreed on the functions, we looked at alternative methods for changing a temperature from Celsius to Fahrenheit. I had an exploration activity for us to explore the last two, but for the sake of time I skipped that step at the meeting. You can find the sheet for that activity in the pdf with the other materials for this lesson.
- F = 1.8C + 32
- F = 9/5 C + 32
- To go from Celsius to Fahrenheit, double the number, subtract 10% and add 32
- Double the Celsius temperature and add 30
When you walk across the Brooklyn Bridge, you can see a large digital sign that displays the time and temperature, altrernating between Celsius and Fahrenheit. A little known fact is that when I was in high school, from my window I could see the Watchtower sign.
To practice our various conversion methods, we watched a video that starts with a Celsius temperature of 21 degrees Celsius and converted it to Fahrenheit.

The guesses were 72 degrees, 69.8 degrees, or 70 degrees. Try it for yourself and then watch the video.
What’s going on with Mark’s mom’s data?
Feeling confident about our ability to convert temperatures from Celsius to Fahrenheit, we did a Stand and Talk in pairs. My mom still lives in the apartment I lived in during high school and, at my request, has been collecting data, recording the temperature in both Celsius and Fahrenheit three times a day since early-January. Here’s the chart the pairs looked at:

Is there anything unusual going on here?
There are lots of things to notice – several folks were impressed at my mom’s ability to gather data at roughly the same time each day. The thing that we spent the remainder of the meeting discussing was how it is possible that the same temperature in Celsius could result in different Fahrenheit temperatures. For example, if you look on Thursday, January 10 -1 degrees Celsius in the morning was equivalent to 31 degrees Fahrenheit, but that afternoon -1 degrees C was equivalent to 32 degrees Fahrenheit. And what about that 0 degrees Celsius on Jan. 15th-16th? We spent the rest of the meeting trying to figure out what was going on my my mom’s data.
Just before the end of the meeting, we came back together for a few minutes to debrief. I showed the following video and asked if anyone could explain what was happening:
-3 x 1.8 + 32 is 26.6 degrees, which we expect to be rounded up to 27 degrees the same way the 69.8 degrees was rounded up to 70 degrees in our earlier example. So why doesn’t that happen here?
Linda explained that one explanation is that the -3 degrees is not necessary exactly -3. It could be any temperature between -2.5 degrees and -3.4 degrees. When we see any temperature, we really should see it as a range of temperatures.
And the end of the meeting, I shared the following questions for further exploration. The idea is not to go through them all, but to read through them and play around with any that seem interesting.
Exploring Celsius and Fahrenheit
- What is going on with Mark’s mom’s data?
- Another method for estimating a conversion between Celsius and Fahrenheit is to have a general temperature sense around certain benchmark temperatures. We know water freezes at 0° Celsius/32° Fahrenheit and boils at 100° Celsius/212° Fahrenheit. What would be a reasonable temperature for in both Celsius & Fahrenheit for —
- swimming at the beach?
- wearing a winter coat?
- room temperature?
- baking in an oven?
- a hot cup of cocoa?
- ice cream?
- a cold glass of lemonade?
- the human body?
- The hottest recorded temperature on Earth is 134°F (10 July 1913 at Greenland Ranch, Death Valley, California, USA). The coldest is −128.6 °F (July 21, 1983 at the Soviet Vostok Station in Antarctica). What is that range in Celsius?
- Are there other ways to write either of these equations that make it easier for you to calculate in your head?
- F = 9/5 C + 32 C = 5/9(F – 32)
- Can the number of degrees Celsius ever equal the number of degrees Fahrenheit for the same temperature?
- In an 1891 study, Carl Wunderlich reported the mean body temperature of the participants to be 37° Celsius, which converts to 98.6° Fahrenheit. This is where we get the “normal” body temperature we think of today. What if Wunderlich rounded the actual mean body temperature to 37°? Given his rounded answer of 37° C, what is the range of healthy human body temperature in Fahrenheit?
- Choose one of the alternate methods to explore. Does it always work? Is it better at certain temperatures? Can you create your own method?
- To go from Celsius to Fahrenheit, double the number and add 30
- To go from Celsius to Fahrenheit, double the number, subtract 10% and add 32
- If the Brooklyn Bridge sign reads 23°C, what could the temperature be in Fahrenheit? Is there more than one possibility? Which one of the possible Fahrenheit temperatures do you expect to be displayed? How sure are you?
- If you see the Celsius temperature on the sign, you can make a prediction about the Fahrenheit temperature that will appear. Is the probability of your best prediction the same no matter what Celsius temperature you see?
- If the Brooklyn Bridge sign displays 15° C and 60° F, what can you say about the actual temperature?
- Is it possible for the Brooklyn Bridge sign to display 27° C and 82° F for the same actual temperature?
- If you see 39° F on the Brooklyn Bridge sign, what would you predict for the Celsius temperature that will appear next? What is the probability that your predicted Celsius temperature will appear next?
Teaching Materials
- The url 1 link above will take you to all of the handouts and student materials, including a handout with the exploration questions above. (These materials can also be found using the docx link above, in case teachers want to edit or adapt them).
- The url 2 link above will take you to a set of slides with notes that you can use to teach this lesson with students.
If anyone does use it with students I would love to hear how it goes!
In Attendance: Ramon, Brigette, Solange, Eric, Linda, and Mark
Programs Represented: The Adult Learning Center at BMCC, the Brooklyn Public Library, LaGuardia Community College, the CUNY Adult Literacy PD team
Respectfully submitted by Mark.
