
I decided to lead a meeting on function diagrams because I’m intrigued by the possibilities of teaching with them and because I wanted to introduce the resources that the math educator Henri Picciotto makes available. I have to admit that I haven’t spent that much time thinking about to teach with function diagrams, but I was interested to see what we can learn together by exploring this visualization.
After a short welcome, we started looking at function diagrams with a slow reveal: https://docs.google.com/presentation/d/1i7imERaktP69MpMv9BTWBOUCpqCnCIb-3Fh6YR9g4lU/edit?usp=sharing

What do you see?

What do you notice?

What predictions can you make?

How were your predictions?
And so on…

What questions could we ask?
By the end of the slow reveal, we had looked at the following diagrams:

And brainstormed these questions and ideas for exploration:

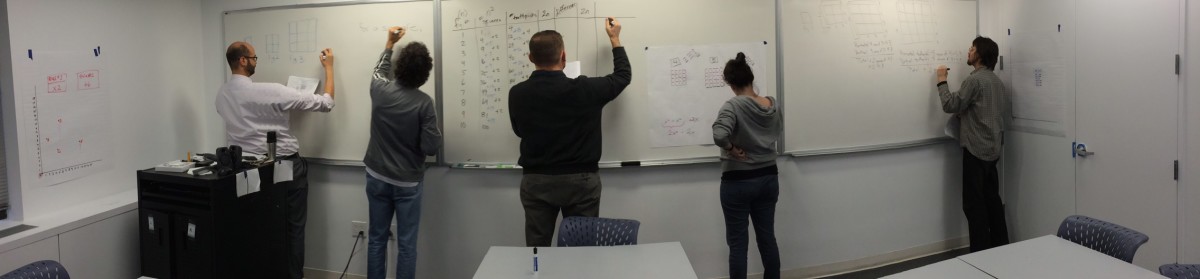
In small groups, we explored some of the questions above. Here is a sample of the explorations from the groups:

The first two function diagrams have a slope or rate of change of 2. We can see the slope in an in/out table. Can we also see the rate of change in the diagram itself?
The function diagram on the far right shows a function that is not linear? Can you tell what the function is? The green lines show negative number inputs.

Could the diagram on the left represent a function?
This group discussed how teachers might ask students to use patterns to create diagrams without necessarily knowing the function that they are mapping. The diagram on the right shows a possible sequence. In groups of 3, students start drawing lines. The first student connects 2 lines, in this case -1 and -1. A second student makes another connection, in this case 0 and -2. Then a third student, or the three students working together, would decide where a third line could go that would continue the pattern. Could they then determine the function?

Desmos graph: https://www.desmos.com/calculator/2icmaxuabo
This group explored a few questions: What is the significance of the intersection point of the slanting lines? What happens if you imagine other vertical lines?
A segment of their graph represents a function diagram. For example, the following segment might represent the following x/y values of a function.

How many different functions do you see their diagram?
Link to the Google Slides for this meeting: https://docs.google.com/presentation/d/1Jr4yDKvRFsr7-6PZgUg1Z8FjkVVyJBaLIsL5bhNlp-M/edit?usp=sharing
Link to the function diagrams slow reveal: https://docs.google.com/presentation/d/1i7imERaktP69MpMv9BTWBOUCpqCnCIb-3Fh6YR9g4lU/edit?usp=sharing
Link to Jamboard for this meeting: https://jamboard.google.com/d/1IxkqgZ0IYZCJWDi9cF2vsQI7xXcKV_jZaA-9700KSEU/edit?usp=sharing
More information about function diagrams from Henri Picciotto: https://www.mathed.page/func-diag/index.html
9 function diagrams:
https://www.mathed.page/func-diag/pdfs/nine-fds.pdf
16 function diagrams:
https://www.mathed.page/func-diag/pdfs/sixteen-fds.pdf
